US Treasury yields hold near multi-decade highs as $40.4 trillion debt stock and elevated term premium keep long rates firm
10/22/2026 08:30 am EST
AJ Economy Trend - US Down due to the 10-year yield remaining near 5.1% amid large ongoing deficits, rising interest expense, and a positively sloped curve that continues to lift the discount rate on longer-duration assets
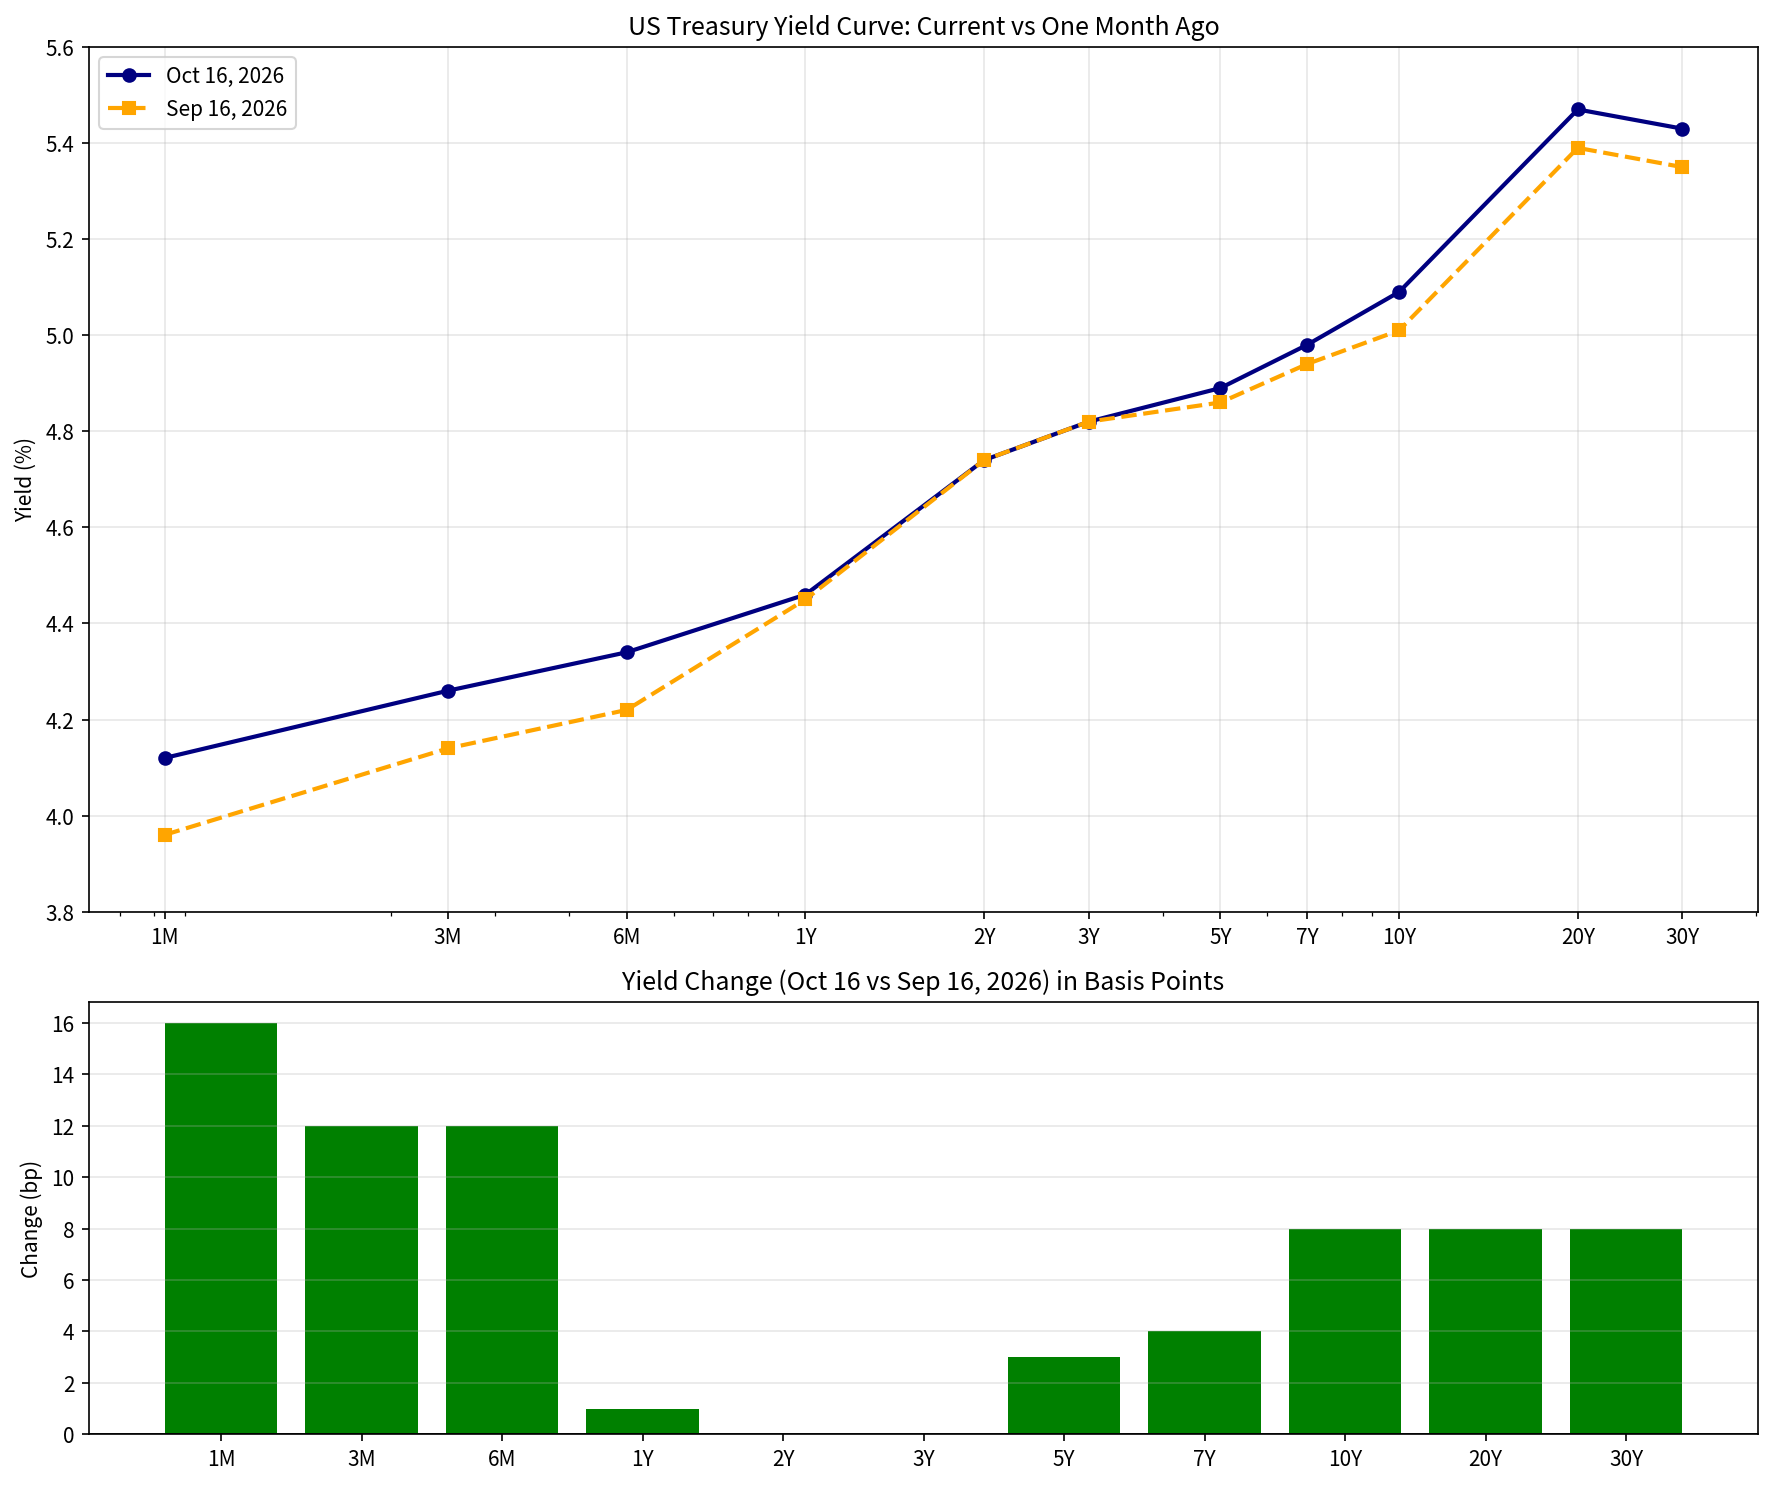
The benchmark 10-year Treasury yield closed near 5.09% on 16 October 2026, according to the Treasury’s daily par yield curve and Federal Reserve H.15 data. That left it roughly 90 basis points higher year-to-date and well above the multi-year average near 4.3%. The 2-year note stood at about 4.74%, producing a 10s/2s spread of roughly +35 basis points. The curve has remained positively sloped since re-steepening earlier in 2026 after the prolonged inversion of 2022–2024. Longer maturities are also elevated: the 20-year and 30-year yields sit in the mid-5% range. These levels keep the term premium positive and continue to pressure valuations of long-duration assets. Total public debt outstanding stood near $40.39 trillion in mid-October, up more than $2.4 trillion over the prior twelve months. Debt held by the public accounts for the large majority of the total. Fiscal year 2026 has so far produced a deficit near $1.99 trillion, with receipts of roughly $5.4 trillion against outlays of about $7.4 trillion. Net interest expense is running at a multi-decade high as a share of the budget; average rates on interest-bearing debt have moved into the mid-3% range while new issuance clears well above that. SIFMA data show gross Treasury issuance running well above $20 trillion on an annualized basis through the third quarter, with primary-dealer average daily trading volume above $1.2 trillion. Auction demand has remained orderly but not euphoric. A mid-October 10-year reopening cleared at a high yield of 5.300%—the highest stop for that maturity since 2000—with a bid-to-cover ratio of 2.77 and strong indirect (largely foreign) participation. Shorter-term bills have cleared in the low-to-mid 4% range, while recent 30-year supply stopped near 5.62%. Primary dealers have taken relatively small residual positions on the longer notes, indicating genuine end-investor absorption, yet absolute yields remain elevated enough to raise the government’s ongoing interest burden. Markets continue to price a Federal Reserve that is in no hurry to ease aggressively. September CPI printed 3.7% year-over-year, still well above the 2% target, with energy and shelter contributing to the upside. Unemployment near 4.2% and modest payroll gains leave the labor market cooling but not collapsing. Higher real yields and a heavier supply calendar raise the cost of capital for households and businesses, tighten financial conditions at the margin, and leave less room for policy error if growth softens further. The next major Treasury refunding and the late-October FOMC meeting will be the near-term focal points for both the yield curve and the fiscal trajectory.
Indonesia’s Jakarta Composite plunges amid MSCI standalone downgrade threat, marking worst equity rout in decades
10/19/2026 03:00 pm EST
AJ Economy Trend - Indonesia Down due to sharp equity and currency sell-off triggered by MSCI’s review of potential downgrade from emerging-market to standalone status, compounding foreign outflows, rupiah weakness, and limited policy space at Bank Indonesia
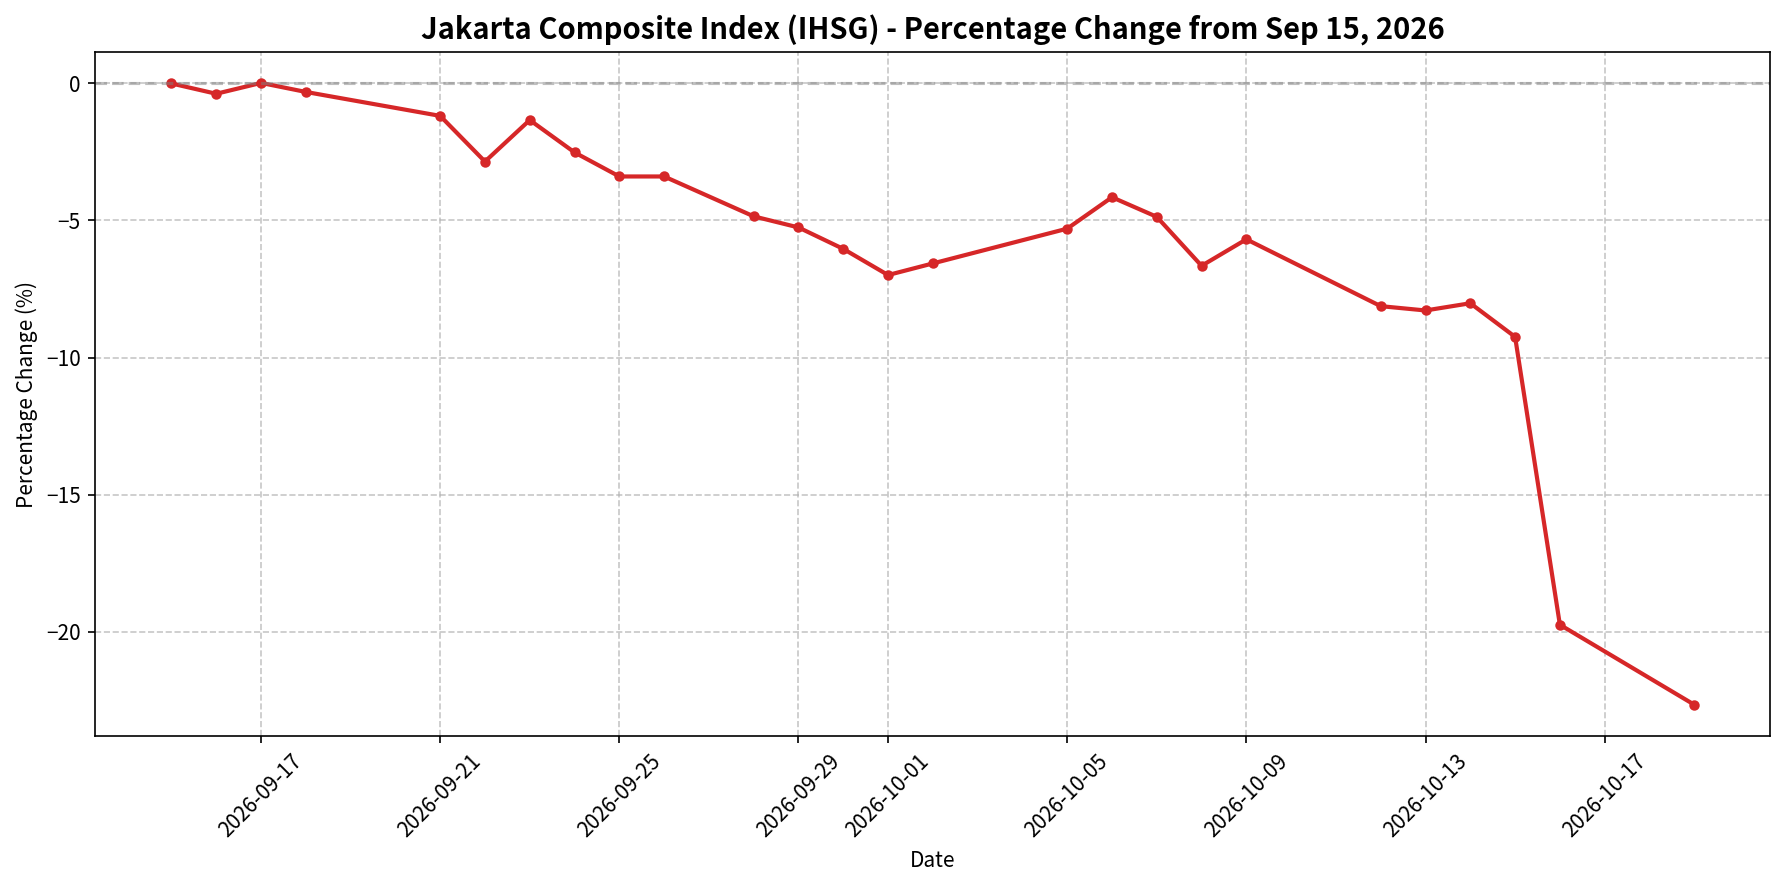
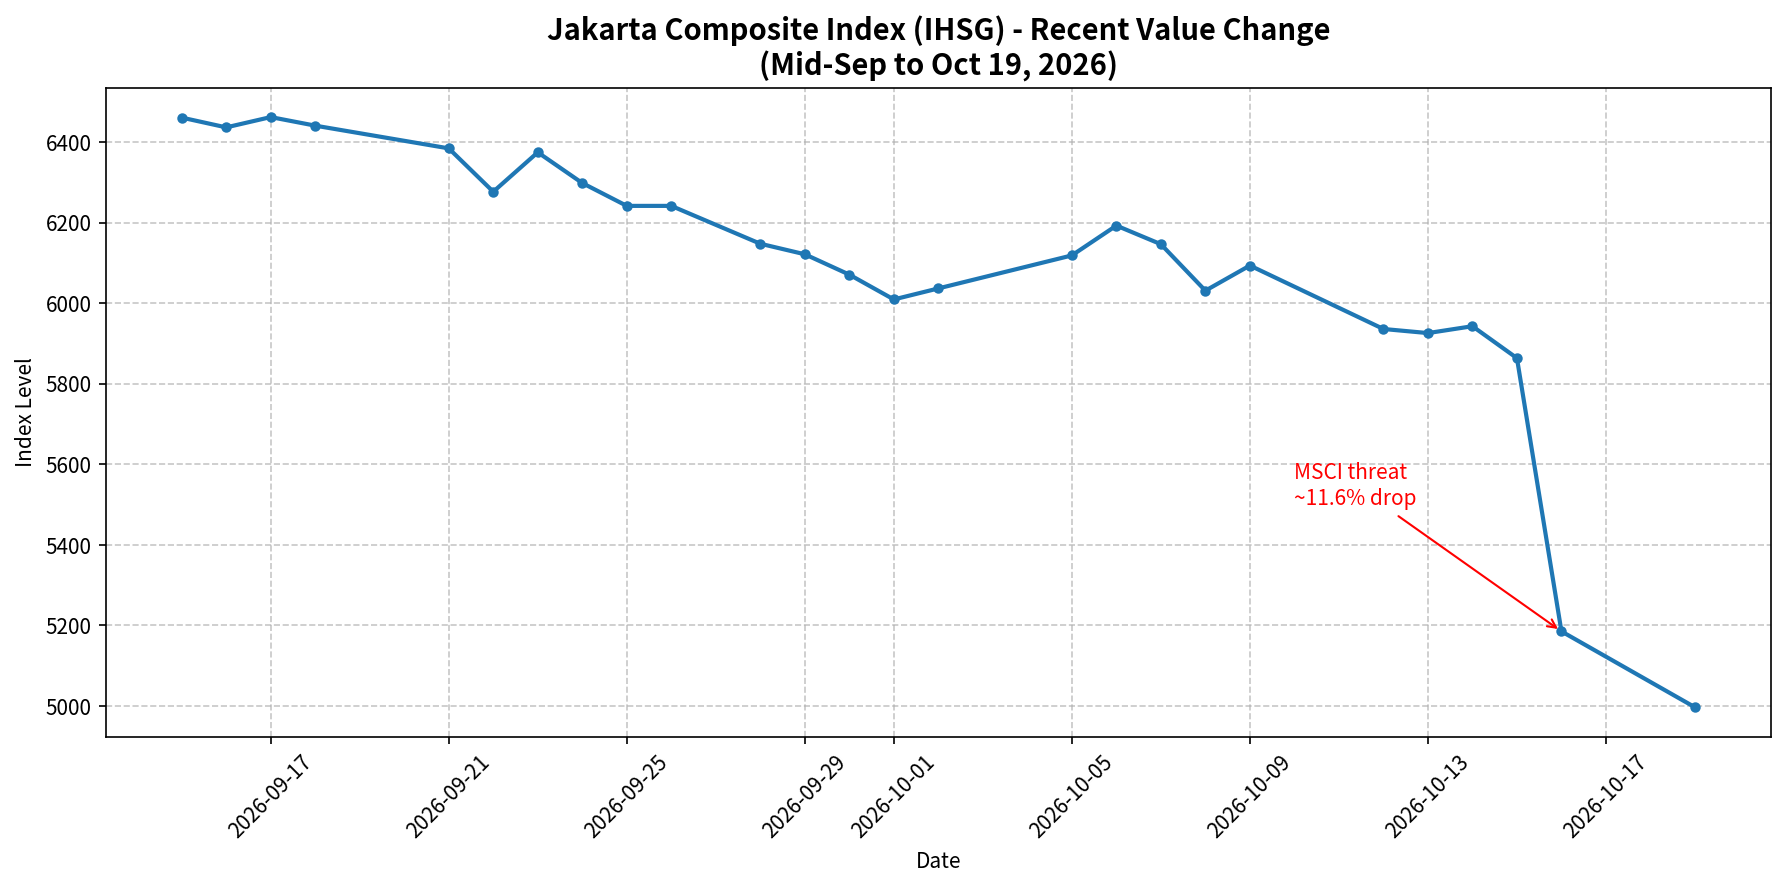
Indonesian financial markets extended a severe sell-off on Monday, with the Jakarta Composite Index (IHSG/JCI) falling as much as 5.4% and closing near 4,996–5,000 after an 11.6–12% plunge on Friday. The move sent the benchmark to multi-year lows and cemented Indonesia as the world’s worst-performing major equity market in 2026. Losses spread to bonds, where 10-year yields rose sharply (around 12 bp in one session to multi-month highs near 7.4%), and the rupiah weakened further toward the 18,000 per USD area.MSCI’s announcement that it is considering a two-step downgrade—beyond the earlier frontier-market concern flagged in January—stemmed from persistent issues around ownership transparency, free-float, and trading practices. Global funds have already withdrawn a net ~$5.1 billion from Indonesian equities in 2026, on track for a record annual outflow. Authorities responded by tightening individual stock daily downside limits (to 7% from 15% through year-end) and intervening in FX markets, while S&P affirmed the BBB rating with stable outlook, citing solid growth and BI’s independence.Macro fundamentals remain relatively resilient but offer little near-term offset. Q2-2026 GDP grew 5.29% y/y; IMF and World Bank forecasts for full-year 2026 sit around 5.1–5.2% (up from prior estimates, supported by domestic demand and government spending). September inflation was 3.28% y/y, still inside BI’s 1.5–3.5% target band (core eased to ~2.84%). The BI 7-day reverse repo rate stands at 5.75% after earlier cumulative hikes. Markets widely expect a hold at the 20–21 October meeting, though some analysts now see a possible 25 bp hike if the rupiah and bond market pressures intensify further. FX reserves remain adequate (~$146 bn range), but the combination of capital outflows, elevated US yields, and energy-related import costs continues to constrain policy flexibility.The immediate market risk is a further reduction in foreign participation if the MSCI review proceeds, which would raise local funding costs and weigh on valuations. Medium-term support rests on domestic consumption, nickel/copper processing investment, and contained inflation, but near-term sentiment is dominated by the index review and currency defense. Next key data include the BI rate decision (21 October) and upcoming FDI and money-supply figures.
AMD GPU demand exceeds supply as Helios racks begin volume shipments and inference workloads dominate
10/18/2026 08:30 am EST
AJ Economy Trend - AMD Up due to data-center AI accelerator demand outstripping available supply, early Helios rack-scale deployments at major customers, and management guidance for a substantial capacity increase in 2027, offset by memory cost pressure on Radeon and limited discrete-share gains versus NVIDIA.
AMD CEO Lisa Su has described 2026 as “the year of inference,” with inference expected to represent roughly 60% of AI compute going forward as agentic workloads scale. The company sees the data-center AI accelerator market approaching $1.5 trillion by 2030. In September, AMD began production shipments of its Helios rack-scale systems, with initial installations at OpenAI, Meta, Microsoft, Oracle, and Anthropic. Production is scheduled to ramp through the fourth quarter and into the first half of 2027.
Su has also stated that current customer demand continues to exceed AMD’s supply and that the company plans a substantial increase in both CPU and GPU capacity for 2027 while extending supply-chain planning three to five years ahead. Second-quarter 2026 results already reflected the shift. Data Center revenue reached $6.7 billion, up 107% year-over-year and accounting for 58% of company revenue, driven by EPYC server CPUs and the ongoing Instinct GPU ramp. Total company revenue was a record $11.5 billion, up 50%. Management guided third-quarter revenue to approximately $13 billion (±$300 million), implying roughly 41% year-over-year growth at the midpoint, with results due November 3.
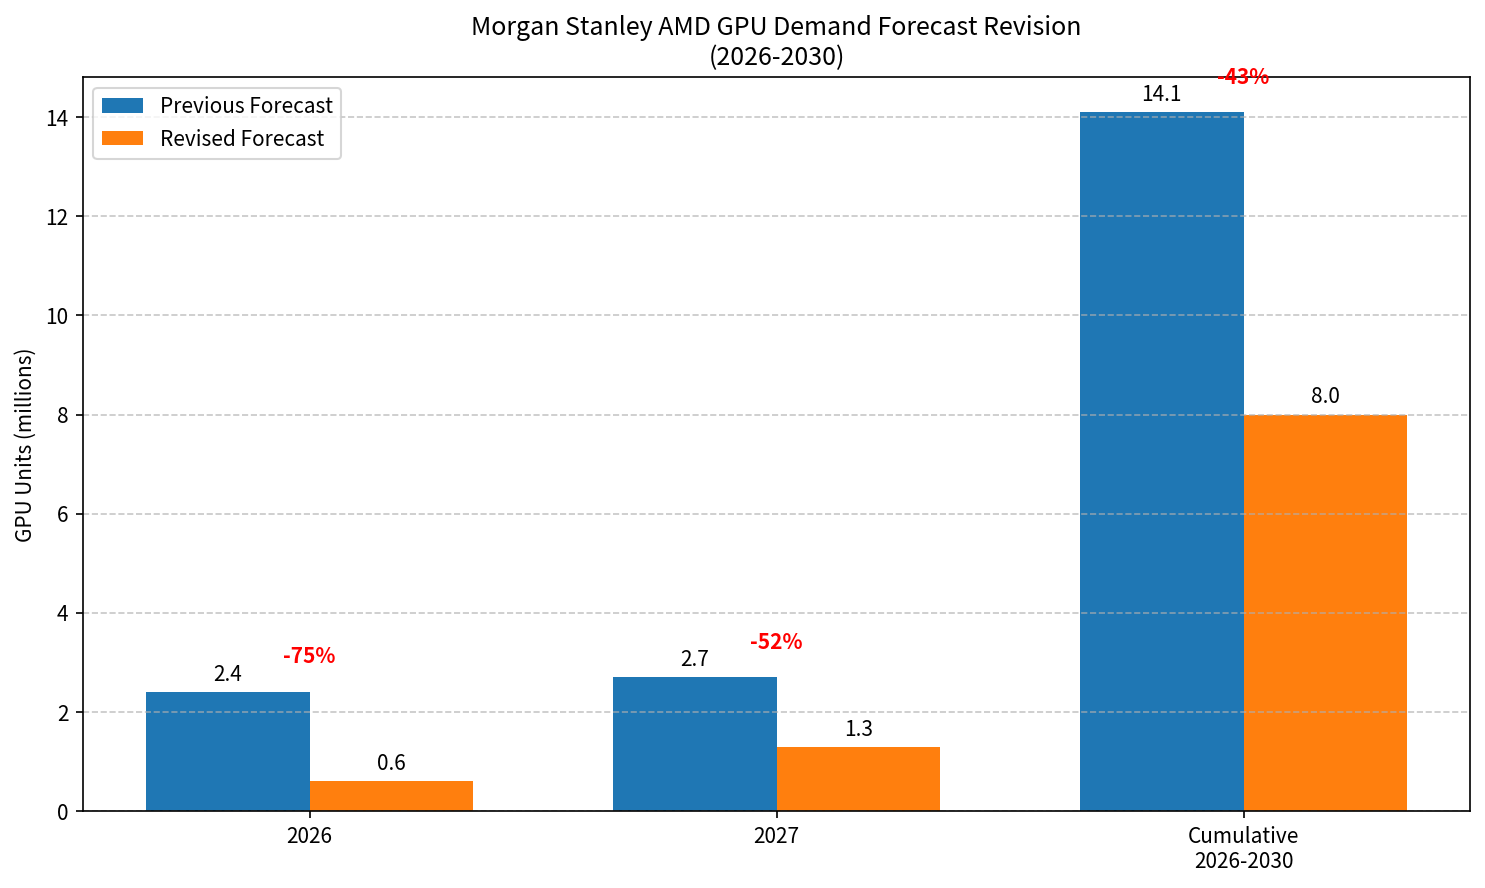
Gaming segment revenue, by contrast, fell 31% year-over-year to $779 million, pressured by lower semi-custom console sales and higher board prices that management said weighed on demand. Supply constraints remain binding across the ecosystem. Lead times for premium enterprise GPUs have stretched, and broader bottlenecks in high-bandwidth memory, advanced packaging, data-center power, and space are expected to keep capacity tight into at least the first half of 2027. On the client side, AMD notified board partners of a GDDR6 memory price increase effective October 1. The Radeon RX 9000 (RDNA 4) series is the most exposed, as earlier generations have lower production volumes. Board partners are expected to pass through higher costs, further elevating retail prices at a time when desktop discrete GPU shipments overall have remained resilient (roughly 12.5 million units in Q2, near multi-year highs) despite elevated pricing. NVIDIA continues to hold approximately 90% of the desktop discrete add-in-board market, with AMD near 8%. Analyst views are mixed on the multi-year GPU volume trajectory. One recent Morgan Stanley revision lowered its cumulative AMD GPU demand forecast for 2026–2030 from 14.1 million units to 8.0 million units while leaving NVIDIA’s outlook unchanged, reflecting concentration of high-end demand and infrastructure constraints (power, packaging). Near-term shipment estimates were cut more sharply. Company commentary and customer commitments, however, emphasize ongoing ramps and multi-gigawatt agreements rather than a near-term demand air pocket. Software improvements on Instinct platforms have also narrowed certain inference cost gaps versus competing systems in specific benchmarks.
For AMD, the near-term story is data-center GPU and server CPU strength supporting revenue growth well above the corporate average, while consumer Radeon pricing and share remain constrained by memory costs and NVIDIA’s entrenched position. Sustained demand above supply supports pricing power in accelerators through 2026–early 2027, but the magnitude of 2027 volume realization depends on successful Helios and next-generation Instinct ramps plus relief in the broader supply chain. Next data points include the November 3 earnings release and further customer deployment updates.
US CPI rose 0.6% in September to an annual rate of 3.7%, hotter than expected on a gasoline surge
10/14/2026 08:30 am EST
AJ Economy Trend - US Down due to hotter-than-expected CPI at 3.7% keeping inflation well above the Fed’s 2% target and raising the odds of further rate hikes into a slowing labor market
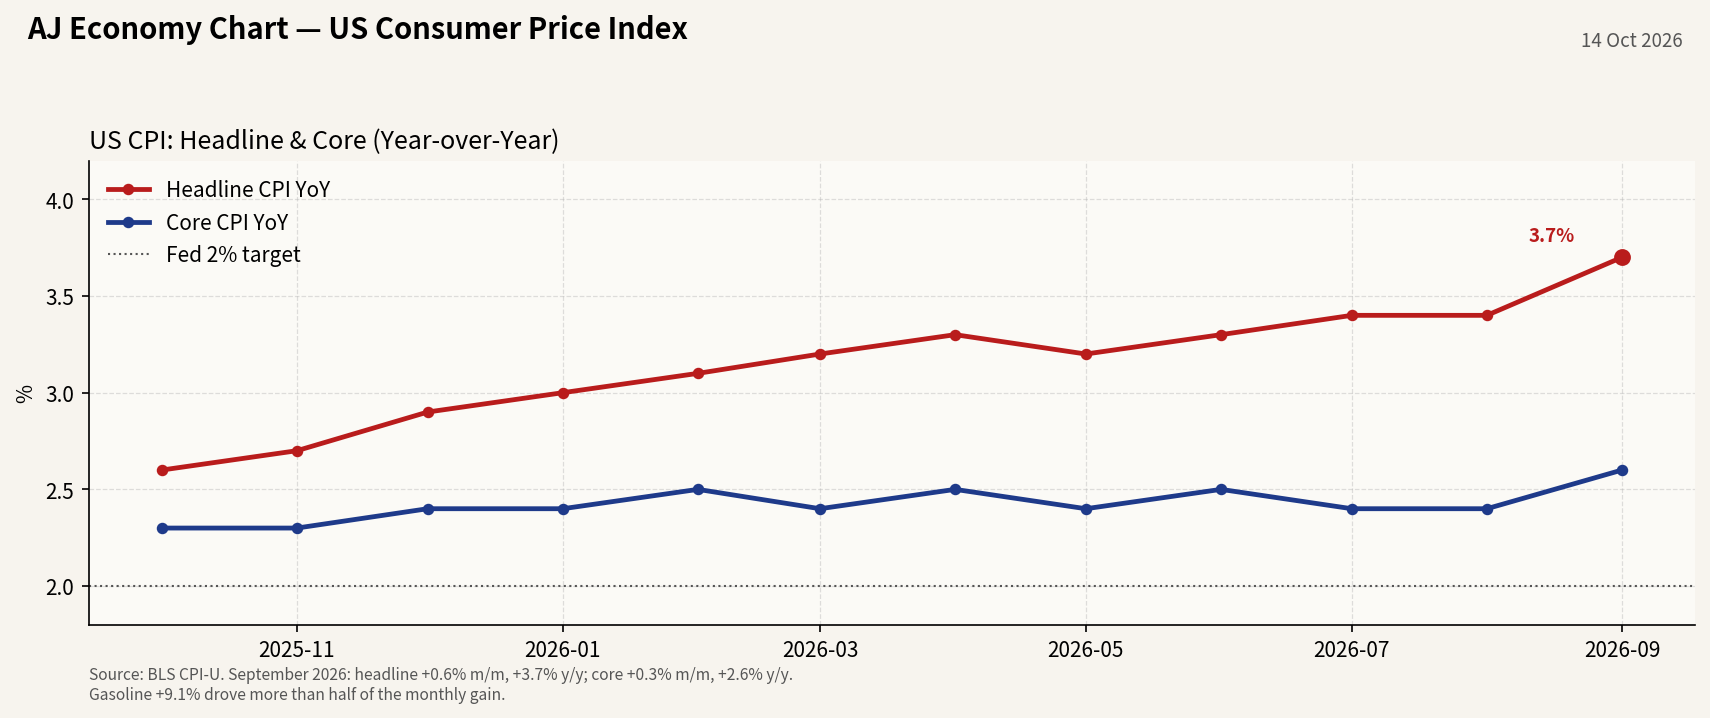
The Consumer Price Index for All Urban Consumers rose 0.6% in September (seasonally adjusted), the largest monthly increase since April, according to the Bureau of Labor Statistics release on 14 October 2026. Over the 12 months through September, headline CPI advanced 3.7%, up from 3.4% in August. Core CPI (excluding food and energy) rose 0.3% on the month and 2.6% year-over-year, both firmer than most forecasts (expectations were roughly 0.6% / 3.6% headline and 0.2% / 2.5% core).
Gasoline was the main driver, jumping 9.1% in the month and accounting for more than half of the all-items increase. The broader energy index rose 5.2% monthly and 20.4% over the year, reflecting higher oil prices tied to Middle East supply disruptions. Shelter rose 0.4%, its fastest monthly pace in five months. Food was essentially flat. The energy shock is keeping headline inflation elevated even as some underlying components remain closer to target.
Markets reacted immediately: Treasury yields rose and equity futures softened as the data reinforced that inflation remains well above the Federal Reserve’s 2% goal. The release is the last major inflation print before the November midterms and comes ahead of the Fed’s late-October meeting. Investors had largely priced a hold, but the upside surprise has put a near-term hike back into discussion if price pressures persist. Average hourly earnings growth has lagged inflation for several months, so real incomes remain under pressure.
The AJ reading is straightforward: energy-driven CPI re-acceleration keeps policy tight. Higher rates for longer raise the cost of money, weigh on housing and credit, and reduce the margin for error in a labor market that is already cooling (unemployment near 4.2%). Next CPI (October) is scheduled for 10 November 2026.The chart below shows the recent path of headline and core CPI into the September rebound.
Canada’s unemployment rate edged up to 6.5% in September 2026 as employment unexpectedly fell by 68,000
10/11/2026 02:00 pm EST
AJ Economy Trend - Canada Down due to second consecutive monthly job losses, rising unemployment, and weakness concentrated in public sector and youth employment, pointing to softening labor market momentum
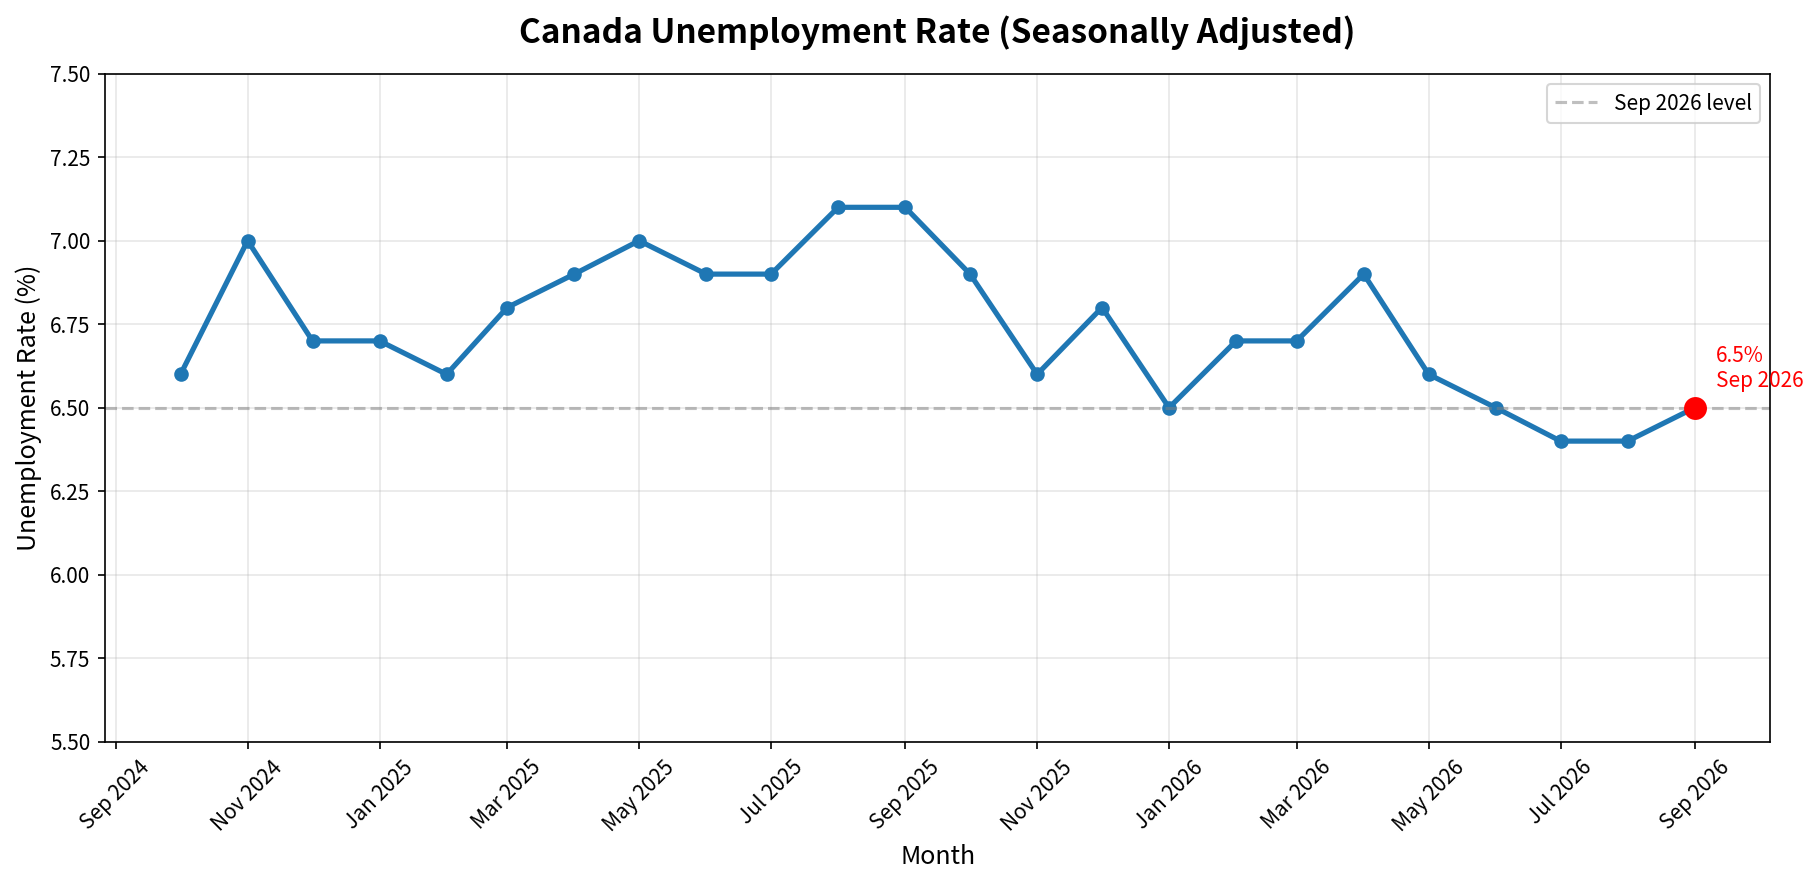
Canada’s unemployment rate rose 0.1 percentage points to 6.5% in September 2026, in line with market expectations but accompanied by a much weaker employment print. Total employment declined by 68,000 (-0.3%) to 21.105 million, far below the consensus forecast for a modest gain of around 9,200. This marked the second straight monthly drop after a 42,000 decline in August and erased a sizable portion of the 181,000 jobs added from April through July. On a year-over-year basis, employment was still up 95,000 (+0.5%), but the recent back-to-back losses reverse the summer rebound and leave net employment down for the year so far.www150.statcan.gc.caThe decline was split almost evenly between full-time work (-35,000) and part-time work (-33,000). Job losses were heavily concentrated among youth aged 15 to 24 (-48,000; -1.8%) and core-aged women (25 to 54; -28,000; -0.4%). The youth unemployment rate held roughly steady near 13.0% as many young workers left the labor force. For core-aged women, the unemployment rate rose 0.3 percentage points to 5.3%, while it edged down to 5.8% for core-aged men.
By industry, the biggest drops came in educational services (-35,000; -2.2%), health care and social assistance (-23,000; -0.8%), and manufacturing (-13,000; -0.7%). Public-sector employment fell sharply by 70,000 (-1.5%), its fourth consecutive monthly decline, while private-sector employment was little changed and self-employment edged lower. Provincially, Quebec saw the steepest loss (-49,000), followed by British Columbia (-20,000) and Manitoba (-4,400). Alberta was a clear outlier, adding 23,000 jobs.www150.statcan.gc.caThe employment rate slipped 0.2 percentage points to 60.6%. The labor force participation rate fell 0.2 percentage points to 64.8%, the lowest level since late 1997 excluding the early pandemic period, partly reflecting an aging population and slower immigration/student inflows. Average hourly wages rose 2.3% year-over-year to $37.64, a modest acceleration from August. The job-finding rate eased to 30.6%, below both the year-ago level and the pre-pandemic.
Australia’s Industry Index plunged 21.1 points to -25.5 in September 2026, reversing the August rebound
10/06/2026 02:00 pm EST
AJ Economy Trend - Australia Down due to a sharp drop in the Australian Industry Index, with activity, new orders and construction back in deep contraction
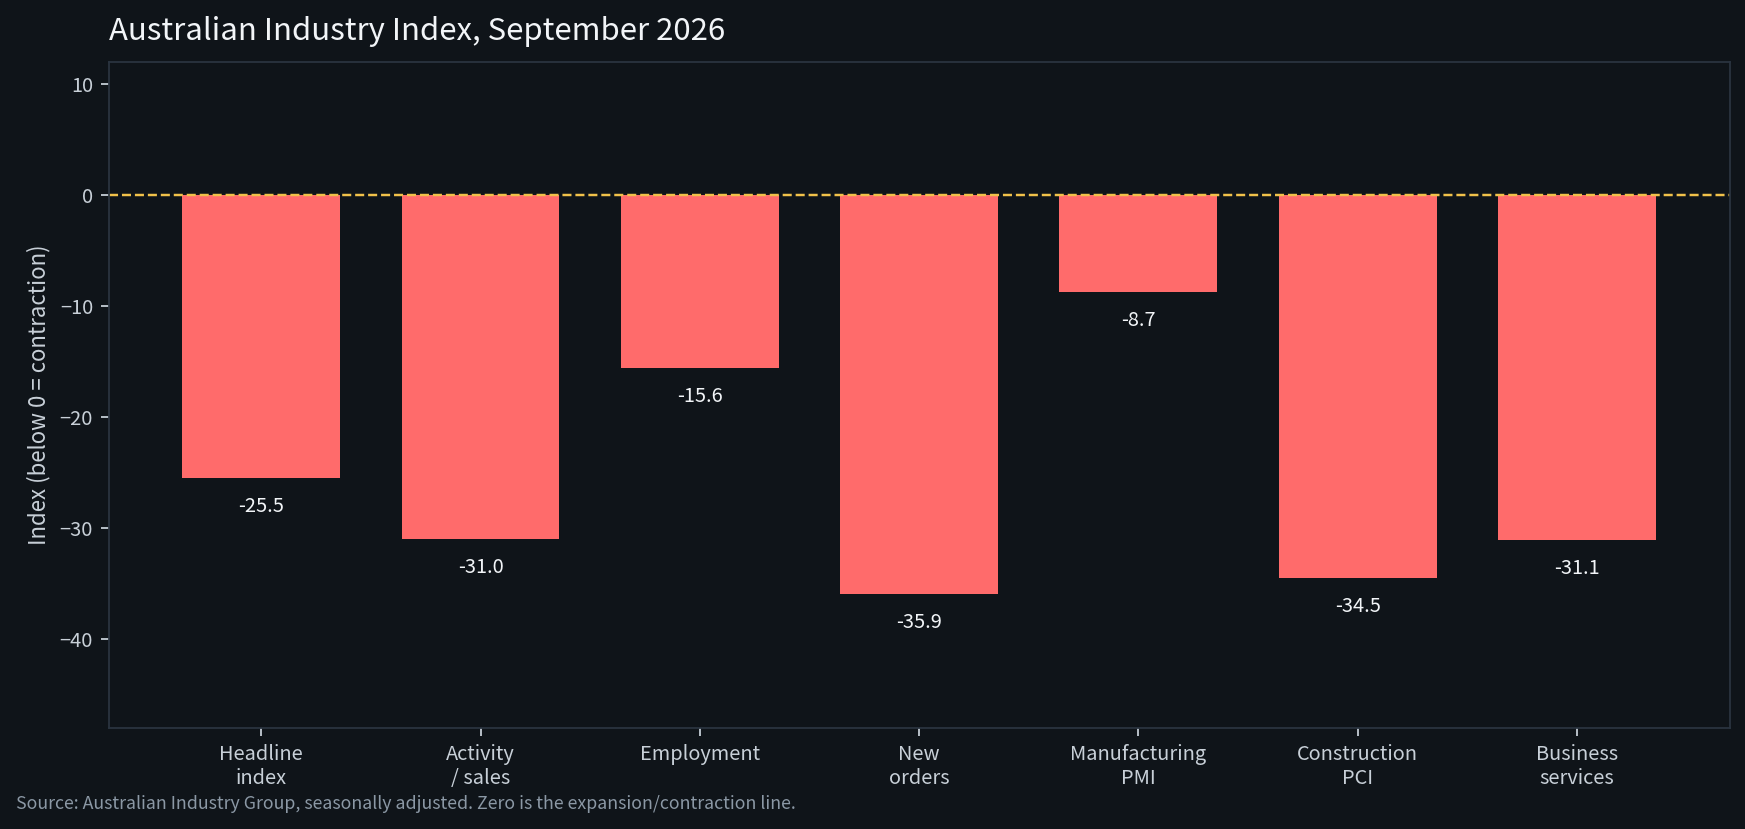
The Australian Industry Index fell 21.1 points to -25.5 in September 2026, seasonally adjusted, according to the Australian Industry Group. The drop wiped out most of August’s improvement and left industrial activity firmly in contraction. Readings below zero indicate contraction. Some market calendars printed the September headline nearer -24.2 after revision differences; the survey’s own release is -25.5.The weakness was broad. The activity/sales indicator fell 28.5 points to -31.0. Employment slipped back into negative territory at -15.6, reversing the prior month’s gain, with firms still citing shortages of qualified tradespeople and trouble retaining staff. New orders fell 22.4 points to -35.9, the weakest of the main activity gauges, and trend scores still point to suppressed orders since the energy crisis.
By sector, the split was uneven:
Manufacturing improved 6.2 points to -8.7, the least weak of the major groups and the highest manufacturing reading since May 2023, but still contracting. Upstream chemicals fell to -14.2 and metals to -26.6 on energy costs, softer orders and import competition. Downstream food, beverage and TCF jumped 39.1 points to 19.8, one of the few areas in expansion.
Construction fell 29.8 points to -34.5. Ai Group said building activity has been slowing since Easter on low consumer confidence and higher materials costs.
Business-oriented services dropped 31.0 points to -31.1.
Cost pressure was the largest reported drag. Input prices eased 10.6 points but stayed high at 56.8, while selling prices rose 13.0 points to only 13.6, leaving a wide gap and margins under strain. Firms cited higher prices for energy, fuel, freight, raw materials, imported components, insurance and property charges, and a second round of fuel and downstream price rises. The wages indicator rose 2.8 points to 49.5. Capacity utilisation eased to 77.2%, though the trend is slightly higher than a year earlier.Uncertainty and tighter finance access also weighed. Businesses reported difficulty forecasting demand, with taxation changes, the Federal Budget and energy-market volatility cited alongside trade disruption. Loan and lease approvals were taking longer as lenders turned more cautious, which limited the ability to fund equipment and respond to new orders. Pockets of demand remained in data centres, defence, renewable infrastructure and some machinery customers.For markets, the September print is a setback after August’s bounce toward the zero line. Forward orders at -35.9 and construction at -34.5 point to soft industrial momentum into the fourth quarter, even as manufacturing contraction eased and a few downstream niches expanded. The next release, covering October, is scheduled for 3 November 2026.
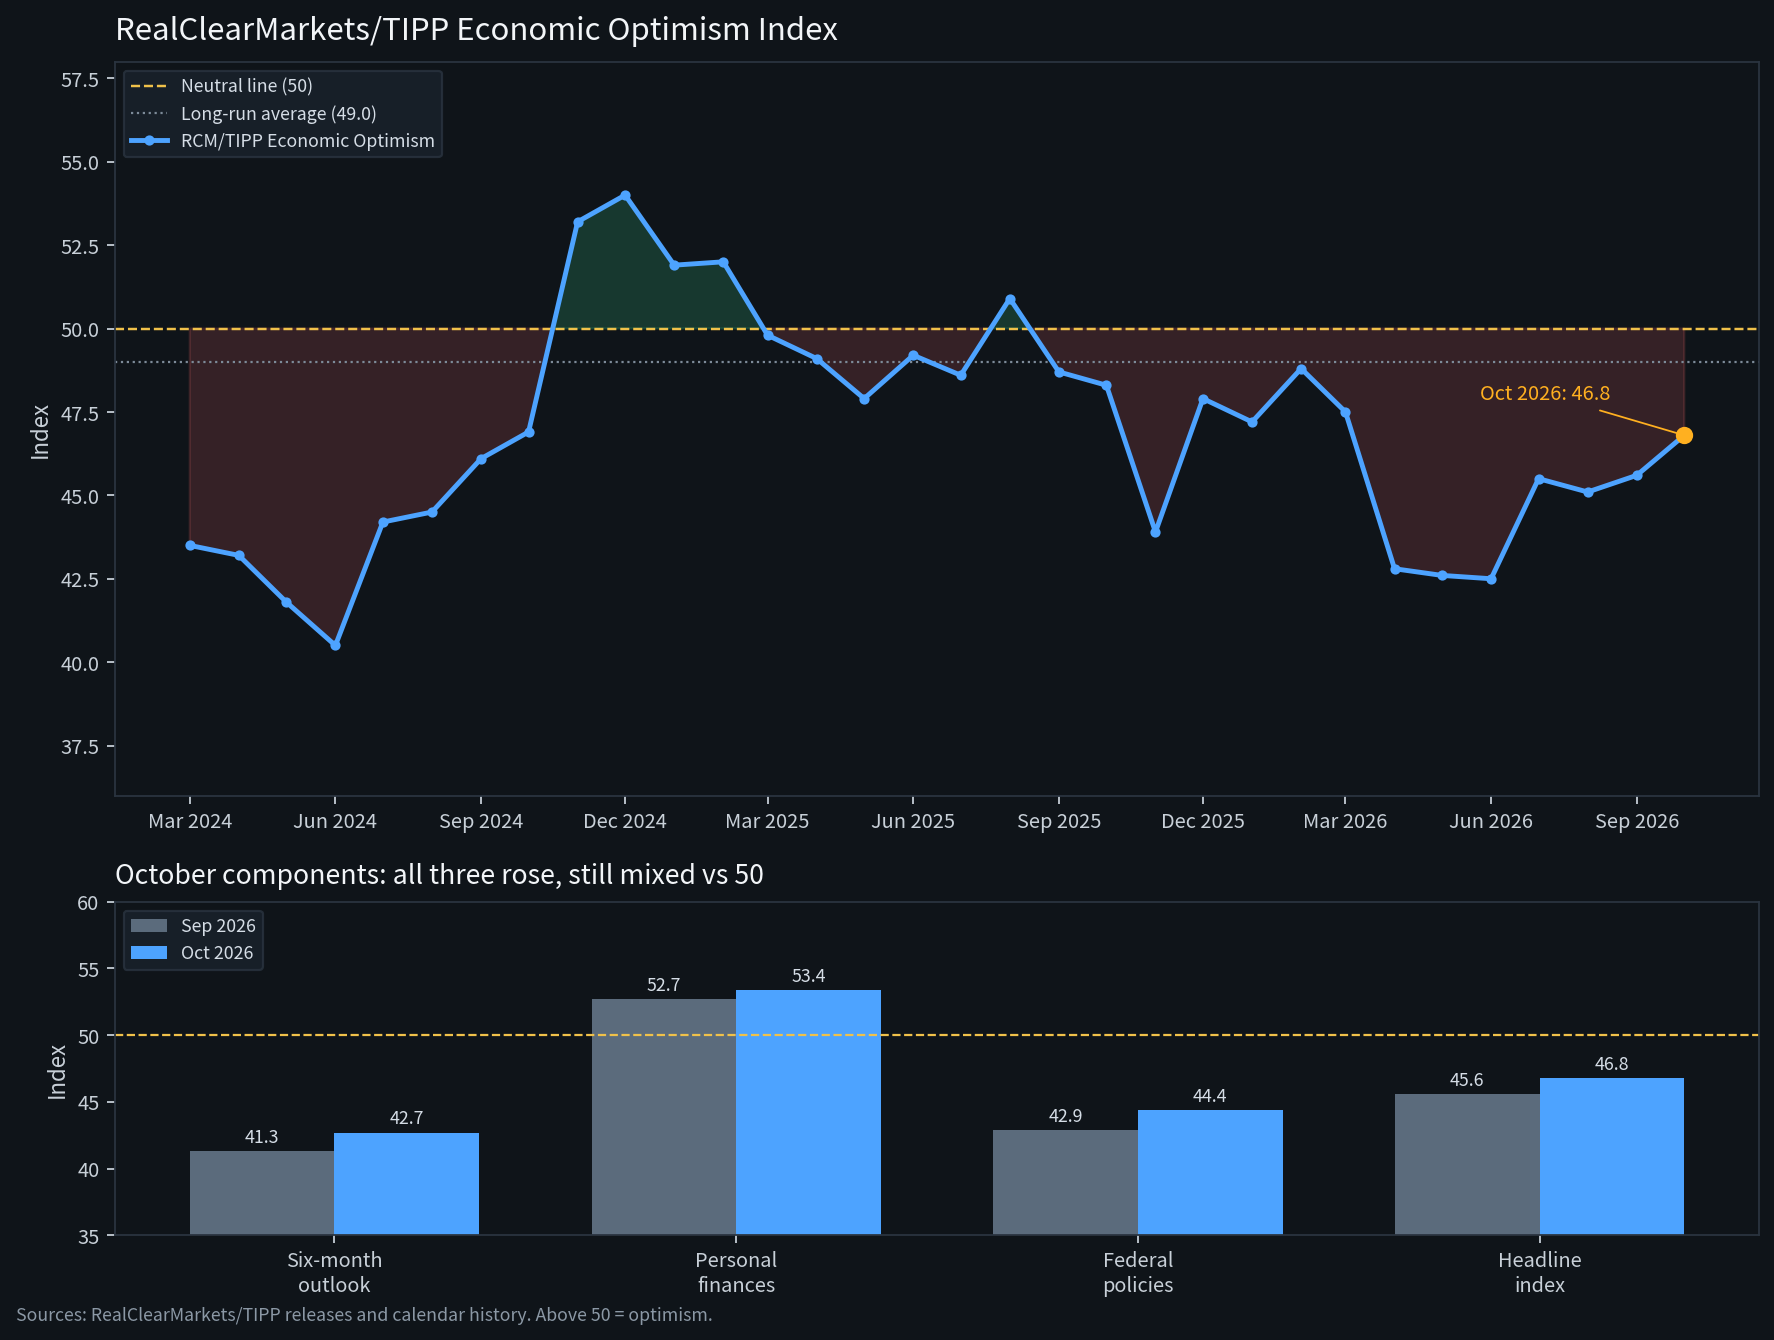
RealClearMarkets/TIPP Economic Optimism Index rose to 46.8 in October 2026, highest since March
10/06/2026 02:00 pm EST
AJ Economy Trend - US Neutral due to a second monthly gain in the RCM/TIPP Economic Optimism Index, still below the neutral 50 line and the long-run average
The RealClearMarkets/TIPP Economic Optimism Index rose to 46.8 in October 2026 from 45.6 in September, a gain of 1.2 points, or 2.6%. The reading beat market expectations of 44.5 and was the highest since March. It was the second straight monthly increase, and all three components advanced together for the first time since July.Even after the gain, the index remains in the pessimism zone. Readings above 50 signal optimism and readings below 50 signal pessimism. October’s 46.8 is the fourteenth consecutive month under 50. The last reading at or above 50 was August 2025, at 50.9. The October print sits about 4.5% below the roughly 309-month historical average of 49.0. Since the series began in February 2001, the index has been at or above 50 in about 41% of months.The improvement was broad-based across the three components, each at its highest since March:
The Six-Month Economic Outlook, which tracks how consumers see the economy over the next six months, rose 3.4%, from 41.3 to 42.7, a second consecutive gain. It remains well below 50.
The Personal Financial Outlook, which measures how Americans feel about their own finances over the next six months, rose 1.3%, from 52.7 to 53.4. It has now stayed above the neutral 50 line for a 28th straight month.
Confidence in Federal Economic Policies rose from 42.9 to 44.4, still in pessimistic territory.
The split between investors and non-investors widened further. Investor optimism rose 0.8 points to 62.3, its highest since September 2025 and a fourth consecutive month above 50. Non-investor optimism fell 0.7 points to 37.2, its lowest since April 2024. The resulting 25.1-point gap is the widest since the index began in February 2001, wider than the prior record of 24.8 points in March 2023.For markets, the headline is a modest upside surprise in the first monthly read on U.S. consumer confidence, which has a track record of leading the University of Michigan and Conference Board surveys. Households are a little less downbeat on the near-term economy and still relatively steady on their own finances, but overall sentiment has not returned to neutral. The record investor–non-investor gap also points to a confidence split that equity markets have not fully closed for households outside the market. The next release is scheduled for November 3, 2026.
10-year Treasury yield held near 5.3% in early October 2026, with the curve still positively sloped after the long inversion
10/07/2026 12:00 pm EST
AJ Economy Trend - US Down due to the 20-plus-year yield grinding higher, lifting the term premium, cheapening long-duration Treasuries and raising the discount rate on long assets
The 10-year Treasury yield was about 5.31% on October 5, 2026, little changed from 5.28% on October 2 and roughly 1.1 percentage points above its level a year earlier, based on daily constant-maturity data. The 2-year was about 4.84% the same day, and the 30-year was about 5.66%. The 10-year minus 2-year spread was about 0.47 percentage points, so the benchmark curve remained upward-sloping rather than inverted.That slope is a clear change from the long inversion of 2022–2024. The re-steepening has come with short rates below intermediate and long rates: bill and front-end yields were clustered near 4.0%–4.5% into early October, while the 5-year was about 5.06%, the 7-year about 5.19%, and the 20-year about 5.70% on October 5. Markets are no longer pricing the aggressive tightening that produced the inversion. They are still requiring a high coupon to hold duration.The mix points to sticky term premium and inflation risk rather than a clean growth boom. Real (inflation-indexed) 10-year yields were still near 2.9% in the October 6 H.15 release, so a large part of the nominal 10-year is real yield, not just expected CPI. Long yields near the highest levels since the mid-2000s also sit against federal debt above $40 trillion and a heavy Treasury issuance calendar. Higher coupons raise the interest bill as older, cheaper debt rolls, which feeds back into supply.For markets, a 10-year near 5.3% and a 30-year near 5.7% keep mortgage rates and corporate borrowing costs elevated and cap how far equity multiples can expand on easier policy alone. The positive 10s–2s spread reduces the classic inversion signal, but the level of yields—not the slope—is the constraint. The next test is whether long rates ease with softer labor and goods data, or stay pinned by supply, energy-linked price pressure, and the fiscal path.
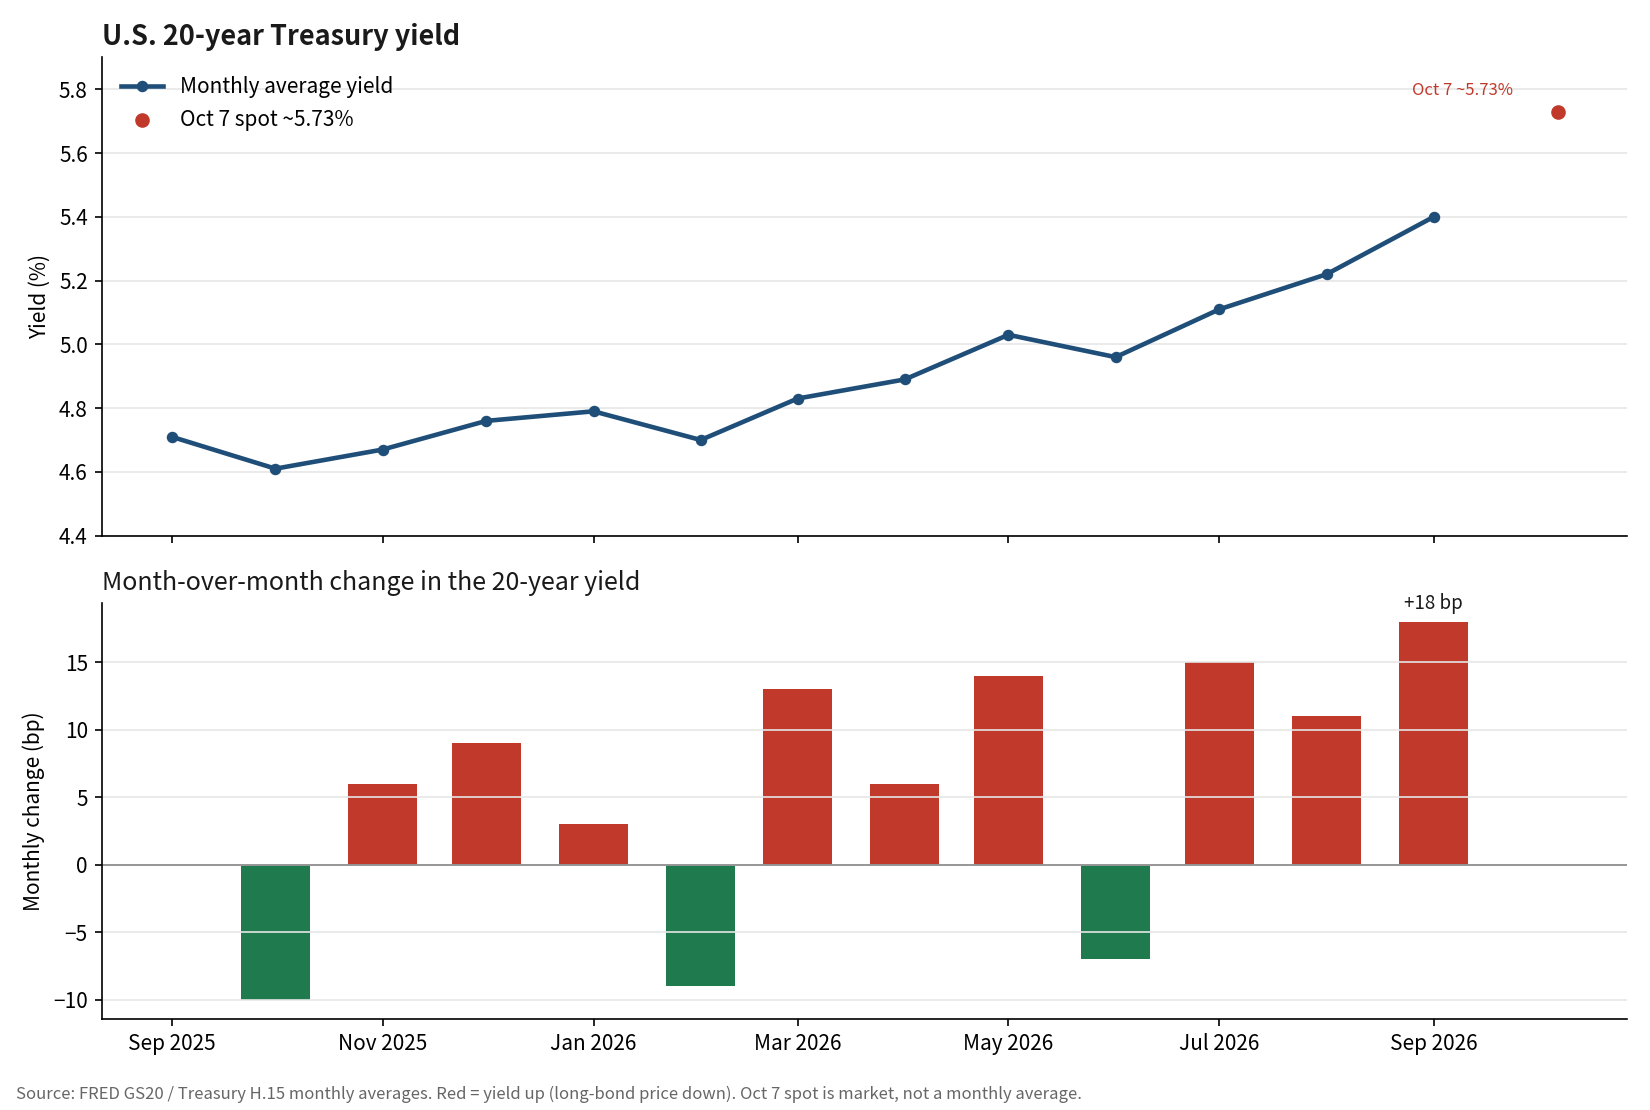
20-year Treasury yield rose to about 5.73% on October 7, 2026, after a September monthly average of 5.40%, up 18 basis points from August
10/07/2026 10:50 am EST
AJ Economy Trend - US Down due to the 20-plus-year yield grinding higher, lifting the term premium, cheapening long-duration Treasuries and raising the discount rate on long assets
The 20-year constant-maturity Treasury yield was about 5.73% on October 7, 2026, near the top of a 52-week range that has run from roughly 4.49% to 5.75%. Treasury daily quotes put the 20-year at 5.68% on October 6, up from 5.24% at the August 31 close and 4.73% a year earlier. The 30-year, the other leg of the 20-plus-year complex, was about 5.69%–5.73% the same session, also at a one-year high. A higher yield is a lower price: the sector that TLT and other 20-plus-year funds track has been the part of the curve doing the most damage to duration.The monthly averages show a steady climb rather than a one-day spike. The FRED GS20 monthly average was 5.40% in September, up 18 basis points from 5.22% in August and 11 basis points above July’s 5.11%. That is the largest monthly increase in the past year. From the October 2025 average of 4.61%, the 20-year is up about 79 basis points on a monthly-average basis, and more than that on the spot quote. The 10-year was recently near 5.27%, so the long end is still above the intermediate curve and well above the funds rate.
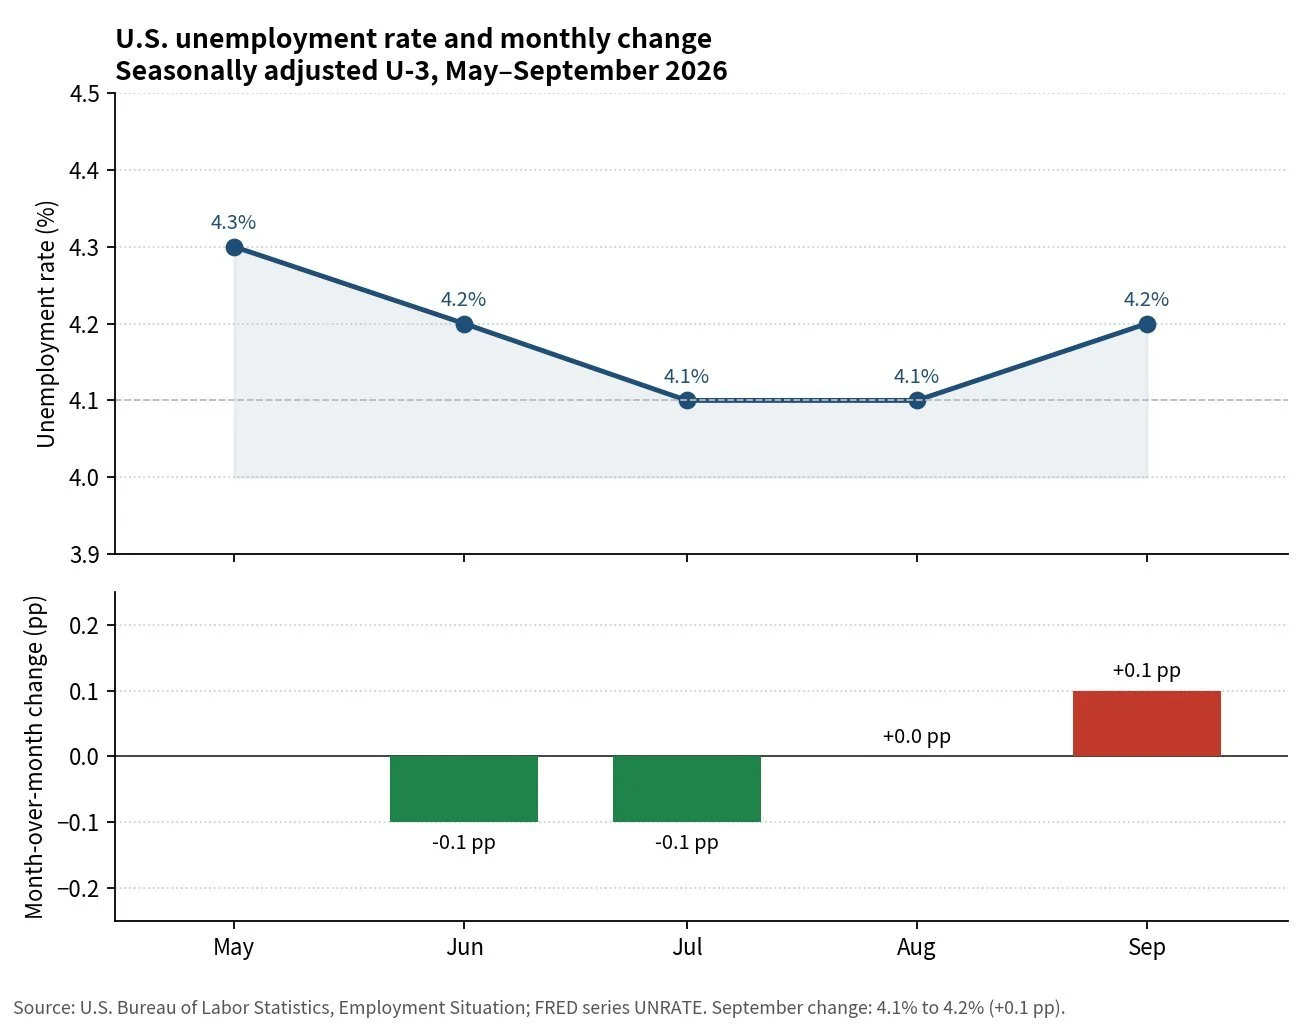
US Unemployment Rate edged up to 4.2% in September as payrolls rose only 29,000
10/02/2026 12:00 pm EST
AJ Economy Trend - US Neutral with the unemployment rate still in a narrow 4.1%–4.3% band since March, offset by soft hiring and downward revisions to prior payrolls
The U.S. unemployment rate rose to 4.2% in September 2026 from 4.1% in August, and the number of unemployed people was little changed at 7.1 million, the Bureau of Labor Statistics reported. The rate has stayed between 4.1% and 4.3% since March and is 0.2 percentage point below the 4.4% reading a year earlier.Among major groups, the unemployment rate for Black workers increased to 7.0%. Rates for adult men (3.9%), adult women (3.6%), teenagers (14.5%), White workers (3.6%), Asian workers (2.9%), and Hispanic workers (4.7%) showed little change. Long-term unemployment, jobless for 27 weeks or more, was essentially unchanged at 1.9 million and accounted for 27.1% of the unemployed.The labor force participation rate was 61.8% and the employment-population ratio was 59.2%, both little changed and with little net change since January. People working part time for economic reasons were little changed at 4.5 million. People not in the labor force who want a job held near 5.8 million. Marginally attached workers fell by 236,000 to 1.5 million, while discouraged workers were little changed at 414,000.On the establishment side, nonfarm payrolls rose by 29,000, below the average monthly gain of 45,000 over the prior 12 months. Employment in every major industry changed little. Health care continued to add jobs (+17,000), but more slowly than its prior 12-month average of +33,000, with gains in ambulatory care (+13,000) and hospitals (+12,000) partly offset by a loss in nursing and residential care (−9,000). Construction was little changed (+11,000) and manufacturing was little changed (+9,000), though manufacturing is up 72,000 since a recent low in December 2025. Financial activities edged down (−7,000) and are down 129,000 since a May 2025 peak.Average hourly earnings rose 5 cents, or 0.1%, to $37.81, and are up 3.0% over the year. The average workweek held at 34.4 hours. July payrolls were revised from +21,000 to −10,000, and August from +162,000 to +133,000, so employment in those two months combined is 60,000 lower than previously reported.For markets, the mix is a labor market that is no longer tightening and is not breaking: the official rate is only a tenth higher and still range-bound, but hiring is running below its recent pace and recent months were weaker than first reported. The next Employment Situation report, for October, is due Friday, November 6, 2026.
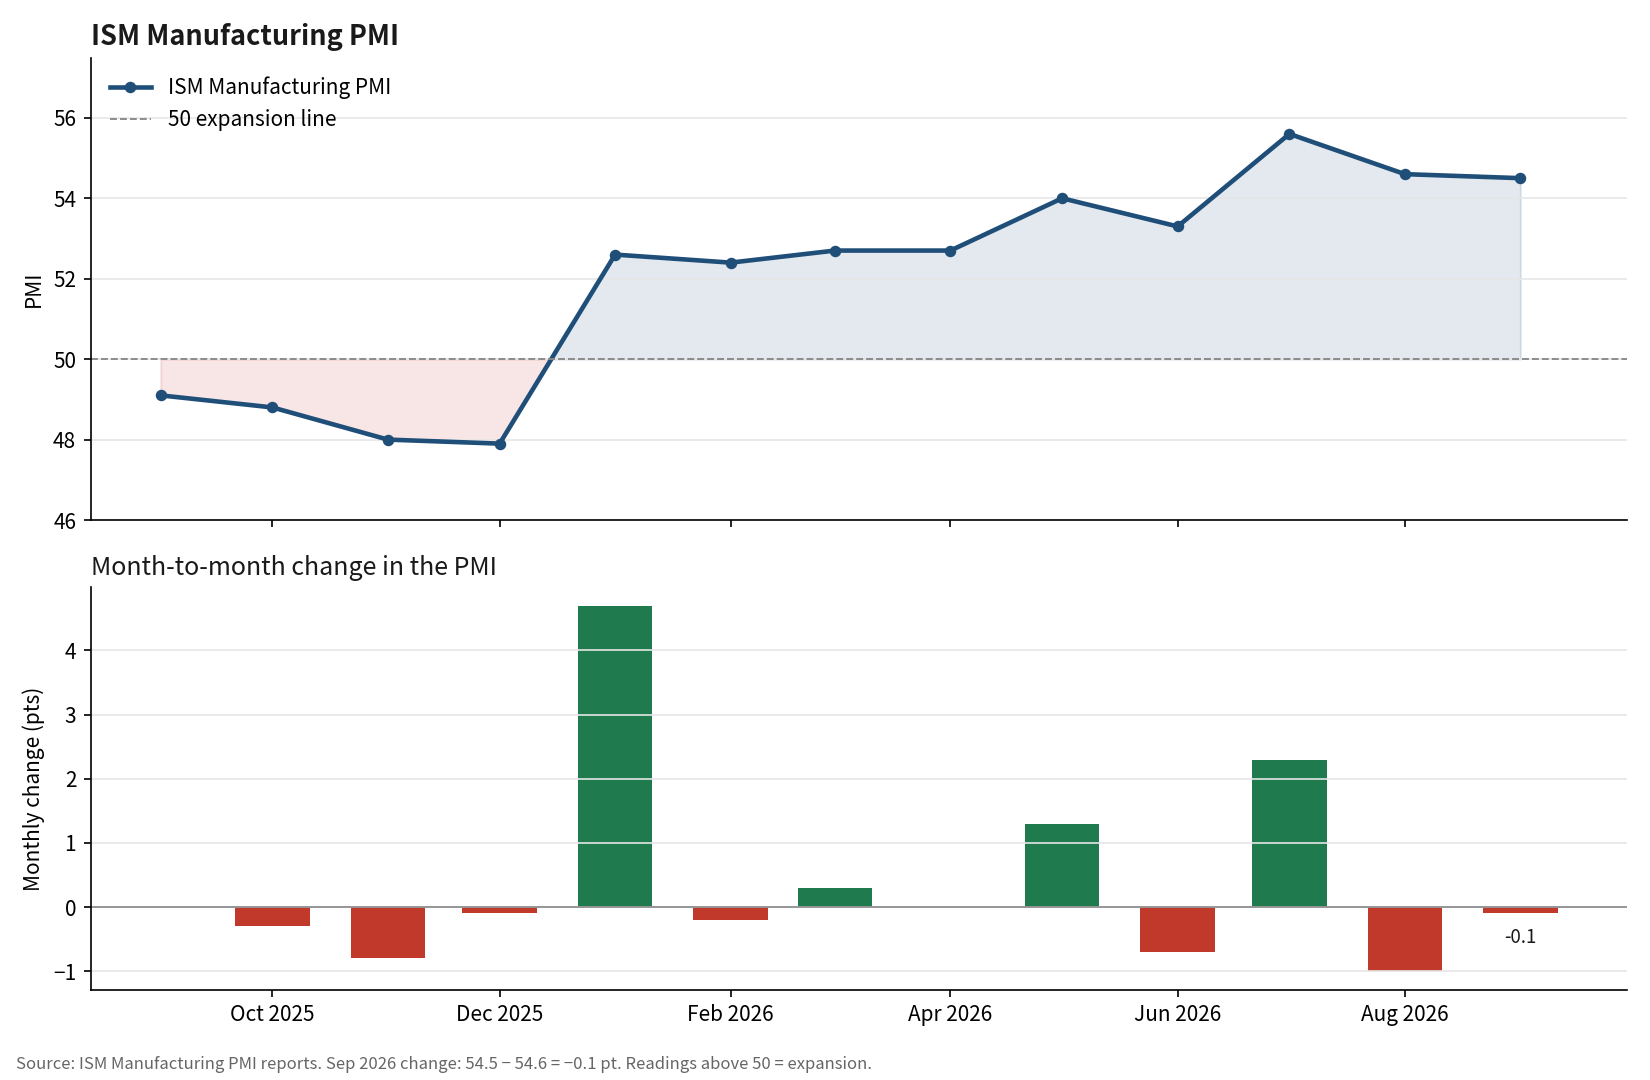
ISM Manufacturing PMI eased to 54.5 in September 2026 from 54.6, a ninth straight month of expansion, while prices jumped to 77.9
10/01/2026 12:00 pm EST
AJ Economy Trend - US Neutral-to-Up due to factory demand, backlogs and hiring still expanding, offset by a sharp rise in input prices tied to steel, aluminum, tariffs and energy
The Institute for Supply Management Manufacturing PMI registered 54.5 percent in September 2026, down 0.1 point from 54.6 in August and a touch below the consensus near 55.0, according to the report issued by Susan Spence, chair of the ISM Manufacturing Business Survey Committee. The sector expanded for a ninth consecutive month, the longest run since 2022, after a prior 10-month contraction. ISM noted that a PMI above 47.5 percent, over time, is generally consistent with expansion in the overall economy, which has now grown for 23 straight months. The September reading is consistent with about 2.4 percent annualized real GDP growth. Demand firmed under the stable headline. New orders rose 1.6 points to 55.3, a ninth month of growth, with five of the six largest industries reporting higher orders. The backlog of orders jumped 4.6 points to 56.4, also a ninth month of expansion. Customers’ inventories fell 1.2 points to 41.6 and remained too low for a 24th month, a level that historically supports future production. New export orders eased 2.3 points to 50.9 but stayed in growth for a third month. Imports slowed to 51.0 from 52.5 and remained above 50 for an eighth month. Output cooled but did not stall. Production fell 1.6 points to 56.7 and has expanded for 11 straight months. Employment rose 1.5 points to 52.7, a third month of growth, though only two of the six largest industries reported higher headcount. Supplier deliveries eased 0.3 point to 59.0 and were still slowing for a 10th month. Raw-materials inventories dropped 2.0 points to 48.6, back into contraction after three months of growth. The main stress was prices. The Prices Index surged 6.8 points to 77.9 from 71.1, the largest move in the report and close to the 78.3 reading in March at the start of the Iran war. About 58.6 percent of respondents reported higher prices, up from 46.2 percent. No commodities were reported down in price. Steel, aluminum, copper, diesel, electronic components and resins were among those listed higher, with panel comments citing tariffs, petroleum-related costs and longer lead times. Sentiment tilted negative: 40 percent of comments were positive and 60 percent negative, with pricing volatility mentioned in 46 percent of negative comments, tariffs in 34 percent and the Iran war in 30 percent. Twelve industries expanded, led by Electrical Equipment, Appliances & Components; Nonmetallic Mineral Products; and Primary Metals. Only Printing & Related Support Activities and Textile Mills contracted. Five of the six largest manufacturing industries grew. For markets, the mix is still expansion rather than a rollover: orders, backlogs and lean customer inventories support factory output into the fourth quarter, and employment has stopped contracting. The offset is the prices print, which reaccelerated toward early-war levels and keeps goods inflation in the policy debate even with the headline PMI only a tenth lower. The next ISM Manufacturing PMI is due in early November.